Crunching the numbers in kindergarten
Published 7:01 am Saturday, March 16, 2019
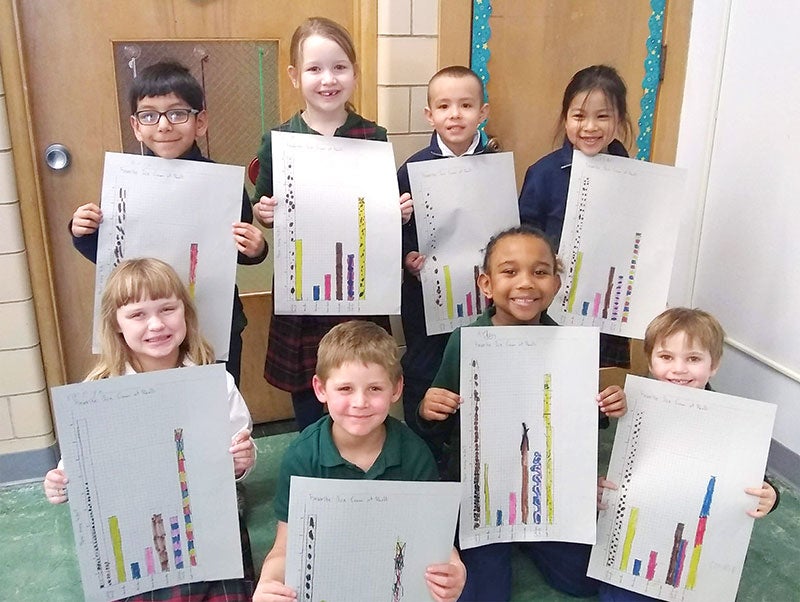
- Pacelli kindergarten students busy crunching numbers. Photo provided
By Liz Kilkus
Pacelli Kindergarten Teacher
Pacelli kindergartners have been hard at work learning about graphing in math. Each of the students could tell you that a graph is something that tells you how many.
We decided that we wanted to make our own graph to find out something about Pacelli staff and students. After taking a vote, it was decided that we would graph favorite ice cream flavors at Pacelli.
Our class worked together to design this project. Students chose flavor options, worked together to devise a plan for collecting data, and walked around the school to ask everyone for their vote. We took turns being in charge of tallying the votes.
After visiting all the elementary classrooms and checking a Google Form sent to middle school and high school, we counted the votes. Cookie Dough won by a landslide.
Full results are listed below. To complete our data analysis project, the kindergartners created their own graph to display the results.
By completing this project, kindergarten students practiced a variety of important skills.
- Working cooperatively
- Planning
- Speaking in front of peers
- Counting
- Creating a graph to present information
Color number of votes
- Cookie Dough: 51
- Superman: 34
- Vanilla: 21
- Chocolate: 20
- Strawberry: 9
- Blueberry: 5
- Cotton Candy: 16
If you are interested in learning more about Pacelli Catholic School visit our website at www.pacellischools.org, email admin@pacellischools.org or call 507-437-3278.

