Study shows some motorists need to work more than average to pay annual fuel expense
Published 8:10 am Thursday, August 29, 2019
With Labor Day and the close to summer driving season on the horizon, gasoline prices this Labor Day are set to be lower than last year for everyone, but some are still putting in more “labor” to fill their tanks, according to GasBuddy
Price wise, for Labor Day, GasBuddy predicts a national average of $2.55 per gallon, down nearly 30 cents from last year and the lowest priced Labor Day since 2016’s $2.20 per gallon average.
The national average gasoline price on Labor Day itself will likely be the third lowest in the last decade, behind 2015 and 2016’s average of $2.42 and $2.20, respectively. Gas prices are likely to face additional headwinds into the autumn as the transition back to cheaper winter gasoline begins in just two weeks while demand for gasoline is also set to begin a seasonal downturn.
By Thanksgiving, GasBuddy estimates that as many as 10,000 gas stations, primarily in Oklahoma, Texas, Louisiana, South Carolina, Alabama, Mississippi, Missouri but also a handful in the Great Lakes, will drop under $2 per gallon, barring any improvement in U.S. trade relations with China, a recent major factor in oil prices.
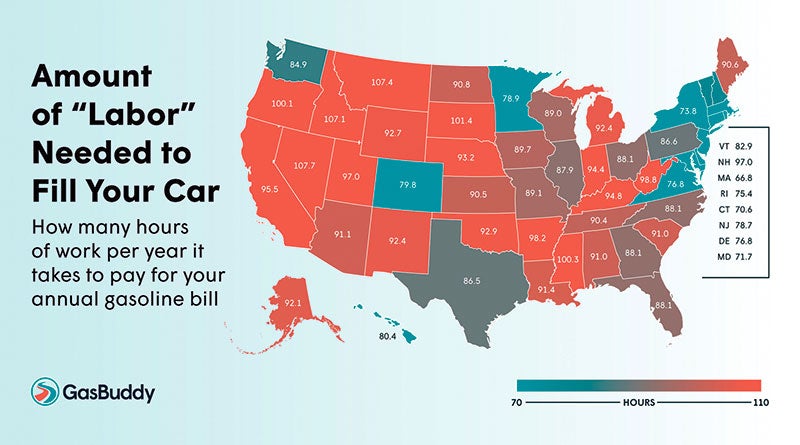
Meanwhile, a new GasBuddy study on how many hours motorists need to work to pay their annual gasoline expenses found that motorists in Nevada had to work nearly 108 hours per year, while those in Montana worked roughly a half-hour less (107.4) and those in Idaho falling into third place (107.1) for hours worked, all well above the U.S. average of 88.9 hours.
Meanwhile, motorists in the Northeast region got off easy, with those in Massachusetts working just 67 hours per year to pay their yearly gasoline bill, followed by Connecticut (70.6 hours) and Maryland (71.7 hours). The difference between the two amounts to nearly an entire work week every year. The West Coast, Rockies and Southeast all generally required more labor than the Northeast, while the Great Lakes was close to average.
The study looked at the latest state-by-state median wage data available from the Department of Labor (May 2018), as well as data from GasBuddy’s payments card to calculate average yearly demand by state, using the average price on record, by state, on August 1, 2019.